

In this article
- What is a KPI dashboard?
- Which KPIs belong on a KPI dashboard?
- Which source should lead for your numbers?
- Which tool should you use for a KPI dashboard?
- How often should you refresh a KPI dashboard?
- What are the rules for good dashboard design?
- Where does AI help with a KPI dashboard, and where not?
- Who owns the KPI dashboard?
- Which mistakes do you often see with a KPI dashboard?
- How do you build a KPI dashboard in six steps?
- Should you build a dashboard yourself or have one built?
- Frequently asked questions
Many companies that walk through our door already have a KPI dashboard. Or two. Often someone built it with a lot of enthusiasm, and three months later nobody opens it. The numbers never quite match the accounts, there are thirty charts on it and nobody knows who keeps it up to date.
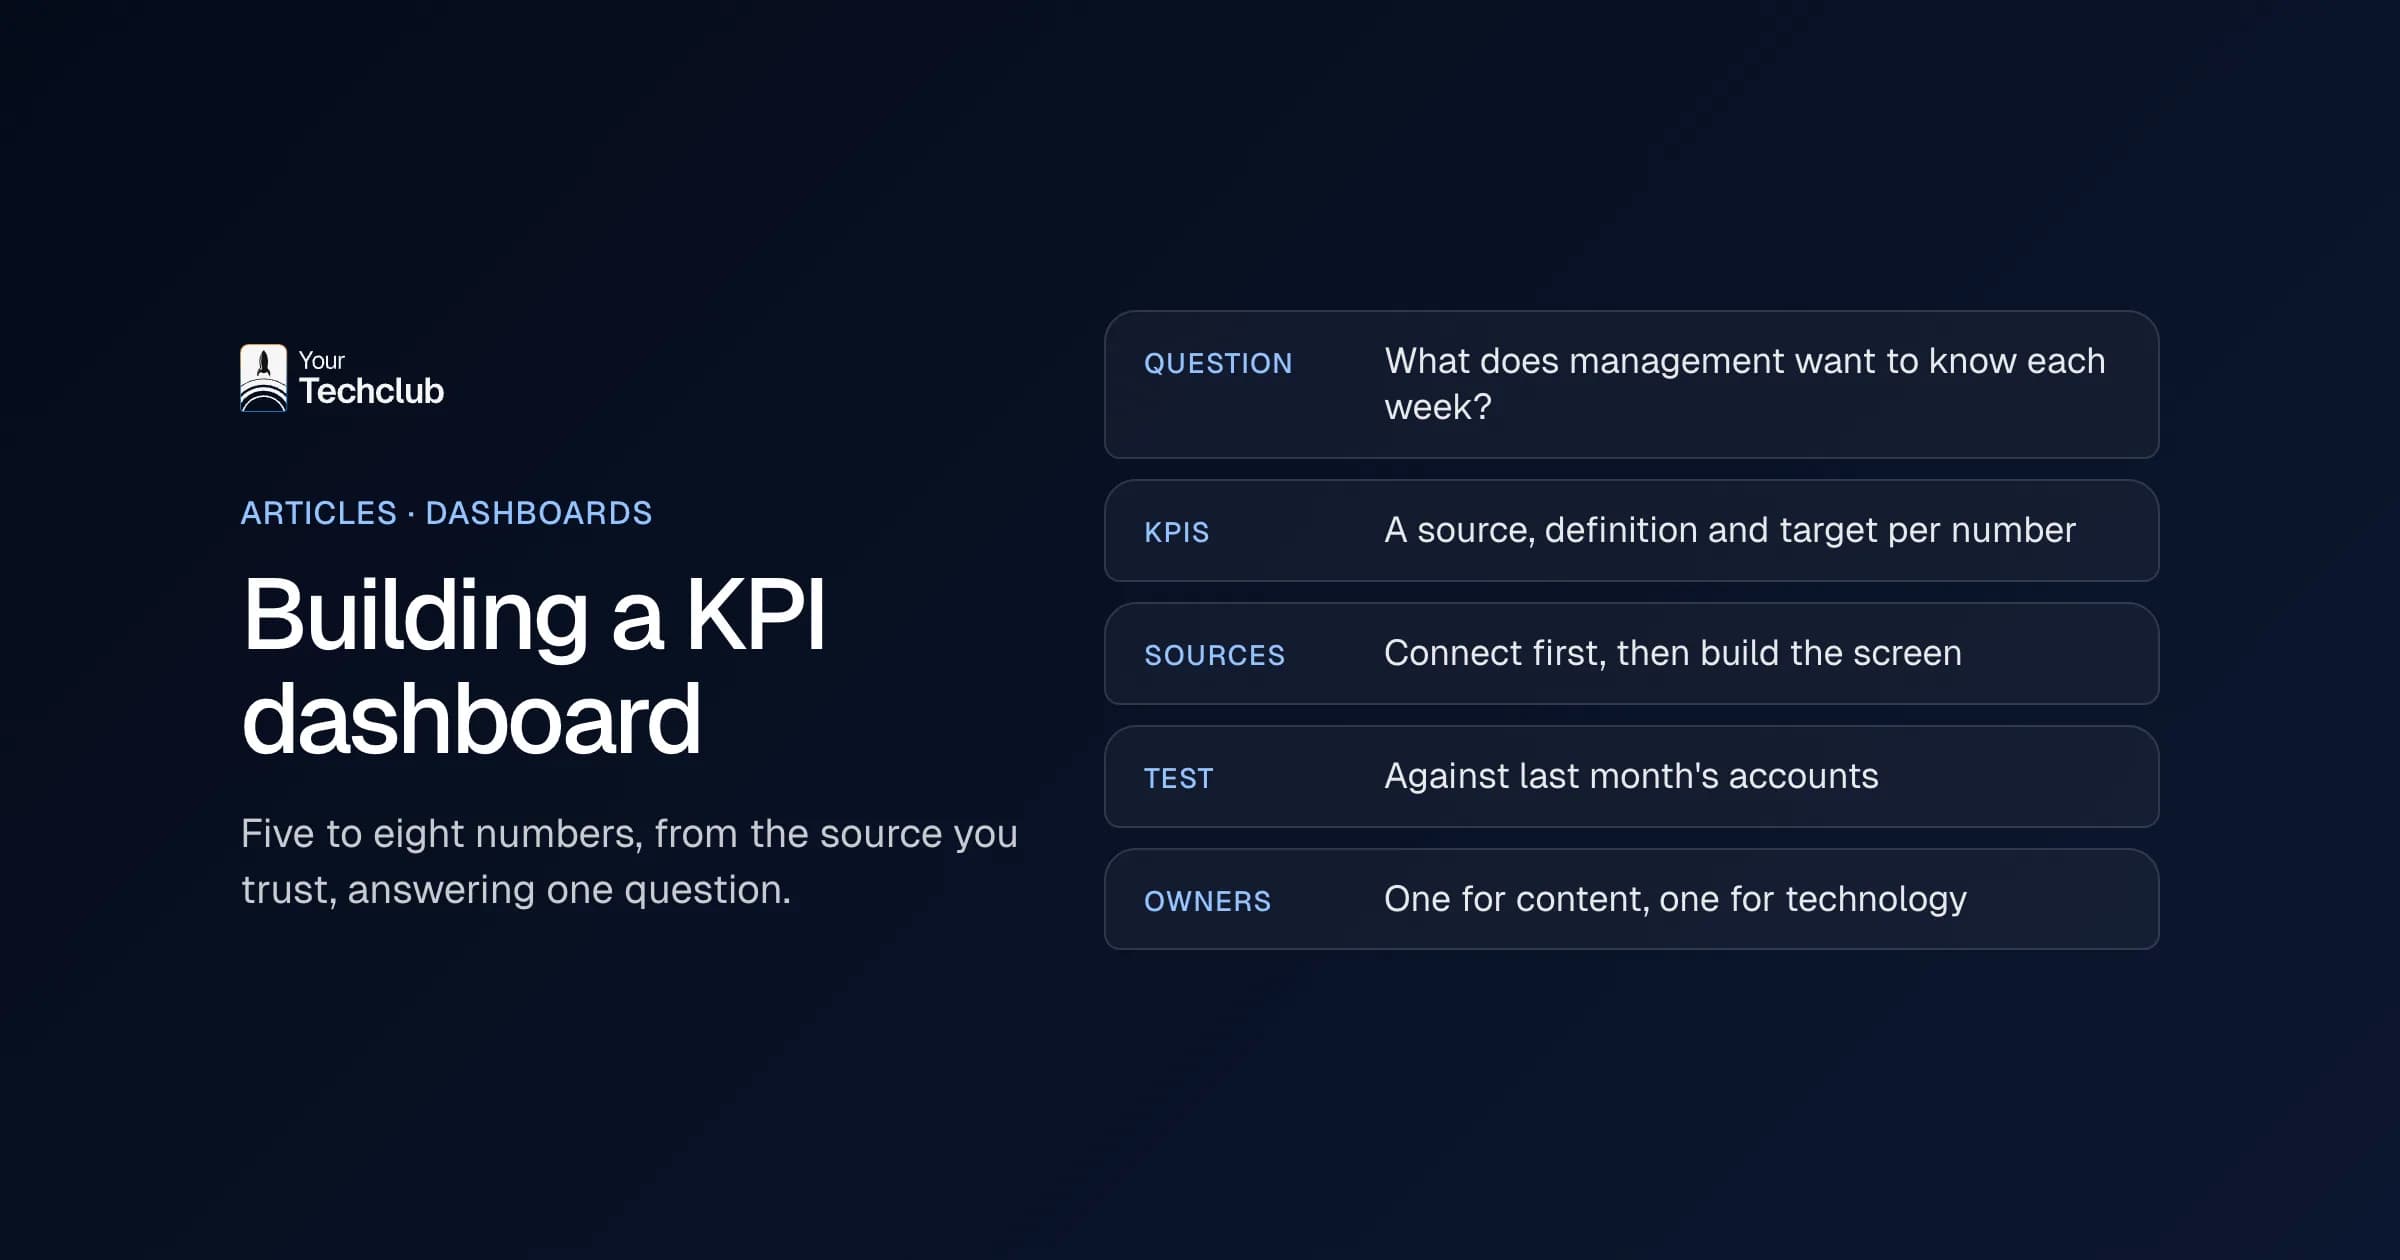
A good KPI dashboard is more boring than you think. It shows five to eight numbers, from the source you trust, and it answers one question. In this article I explain how to build a KPI dashboard that sticks: which KPIs suit your type of business, which system leads, which tool to pick and where AI really helps.
At a financial organisation where we built a data platform, analysts made dashboards that hardly anyone opened. That was not down to their quality. The people who needed the dashboards could not get to them, or could not find them.
What is a KPI dashboard?
A KPI dashboard is one screen with the key numbers that show whether your business is on track. It pulls those numbers automatically from your systems, such as accounting, CRM and planning, and sets each one against a target. Within a minute you see what is going well and where you need to step in.
KPI stands for key performance indicator: a number that says something about the goal of your business. Revenue is a KPI. The number of visitors to your website usually is not, unless your online shop lives on it.
The difference with a report is the rhythm. You read a report once a month, after the fact. You look at a dashboard every day or every week, and it only earns its place when it pushes you to act. That is why many companies call it a management dashboard: it is meant for the people who decide.
Here is the definition I use myself: a KPI dashboard is good when someone can make a decision from it within 60 seconds. If that fails, it is an archive with colours.
Which KPIs belong on a KPI dashboard?
A KPI dashboard needs five to eight numbers that tell you directly whether you are hitting your goals, plus a target or comparison for each one. Choose a mix of lagging numbers (revenue, margin) and leading numbers (pipeline, order intake, planning). Which ones exactly depends on how your business makes money.
That last point sounds obvious. Still, I often see the same dashboard at an online shop and at an installation company. Yet an installer mainly wants to know whether the engineers are fully booked. An online shop wants to know whether the margin still holds after returns. Below is a starting point per type of business. It is an example, not a standard.
| Type of business | Lagging numbers | Leading numbers | From which system |
|---|---|---|---|
| Online shop or wholesaler | Revenue, gross margin after returns, return rate | Orders per day, stock in days, conversion | Online shop, ERP, accounting |
| Installation and construction | Revenue per project, actual cost versus budget | Engineer utilisation, open job sheets, order book | Planning, job sheets, accounting |
| Professional services and agencies | Revenue, billable utilisation, work in progress | CRM pipeline, hours planned versus available | Time tracking, CRM, accounting |
| Staffing agency | Margin per hour, number of placements | Open vacancies, temps free next week | Planning system, payroll, CRM |
| Manufacturing | Output, rejects, margin per product | Order intake, lead time, on-time delivery | ERP, MES or planning |
Two rules help when choosing. First, every number has an owner, someone who can do something about it. Second, if you cannot say what you will do when a number drops, it does not belong on the dashboard. It can go in a report instead.
The same works per department, only smaller. A sales dashboard shows different KPIs from a finance dashboard or an HR dashboard. Would you like someone to summarise those departmental numbers for you every week? Then look at our AI employee for management reporting.
Which source should lead for your numbers?
The leading source is the system where a number is created and where your business officially records it. Revenue and margin come from accounting, the pipeline from your CRM and utilisation from your planning. The dashboard does not recalculate anything the source already holds. It simply shows what is there.
This is where most dashboards break. The sales manager counts revenue when the deal is signed, while accounting counts it at the invoice. Both are right. Yet on Monday there are two different revenue figures in the board meeting, and the conversation turns to who is right instead of what you will do.
So agree on three things for each KPI:
- Source: which system does the number come from?
- Definition: what counts, for example revenue excluding VAT, by invoice date.
- Timing: how often does it refresh: hourly, daily or weekly?
Then comes the integration work. A KPI dashboard is only as good as the integrations underneath. If someone pastes an export from Exact Online (a widely used Dutch accounting package) into Excel every Monday, you do not have a dashboard but a weekly chore. Connect your systems first, then build the screen. You can read how that works under system integrations. If you use Power BI, see the Power BI integration for connectors, APIs and how often you can refresh.
What I would not do: have a data warehouse built before you know which five questions you want answered. Start small, with two or three sources.
Which tool should you use for a KPI dashboard?
For most SMEs it is a choice between Excel, Power BI, Looker Studio and custom software. Excel is enough with one source and few users. Power BI fits if you work in Microsoft 365. Looker Studio suits data from Google. And you choose custom software when the dashboard has to live inside your own portal or application.
| Tool | Fits | Watch out for |
|---|---|---|
| Excel | One source, a small team, weekly or monthly numbers | Manual work at every update, versions getting mixed up |
| Power BI | Companies on Microsoft 365 with several sources | Licences for sharing and a data model that someone has to manage |
| Looker Studio (now Data Studio) | Marketing and data from Google Ads, Analytics and Sheets | Integrations with Dutch packages often need a third-party connector |
| Custom | Dashboards in your customer portal, app or own software | More build work, but fully under your control |
One current point about Looker Studio. Since this year Google calls the product Data Studio again, and according to Google the standard version is free for creators and viewers (accessed October 2026). That does not apply to the paid Pro version.
Power BI is the obvious choice if you already have Microsoft 365. At that financial organisation the dashboards run in Power BI too, with access through the Microsoft accounts staff already had. What Power BI costs, which licence you need to share reports and when it is too heavy for your business is covered under Power BI integration.
My advice: pick the tool that fits where your data already lives, not the tool with the prettiest demo. A Power BI dashboard that nobody can maintain is worth less than a good Excel file that fills itself through an integration.
How often should you refresh a KPI dashboard?
For most KPIs once a day is enough, and for financial numbers often once a week. You only need real time when someone acts within the hour, such as an online shop with an outage or a planner moving engineers around. So choose the rhythm based on the decision, not on what is technically possible.
Real time sounds good in a proposal. But it means more integration work, more computing power and more chance of failures. And what use is it if your managing director opens the dashboard on Monday morning anyway?
Also pay attention to the rhythm of your source. Accounting nearly always runs behind, because your team books invoices and bank transactions a few days after they arrive. A dashboard that refreshes every hour then shows the same incomplete number every hour. So for financial KPIs, always show the date of the last booking.
A rule of thumb I often use: refresh one step faster than the meeting in which you discuss the number. If you discuss margin on Monday, a daily refresh is plenty. The licence of your tool also limits how often it can refresh. In Power BI that differs per subscription, see Power BI integration.
What are the rules for good dashboard design?
Good dashboard design starts with one question per dashboard and as few elements as possible. Put the key number top left, use fixed colours for good and bad, always show a comparison with a target or the previous period, and remove anything that does not lead to action. An empty area beats a chart nobody reads.
So dashboard design is less about pretty and more about fast. These are the rules we use ourselves:
- One question per dashboard. "Are we hitting our margin this month?" is a question. "Everything about sales" is not.
- Eight tiles at most. More will fit on the screen, but not in your head.
- Always a comparison. A revenue figure says nothing without the target or last month next to it.
- Red means action. Only use red when someone has to do something, otherwise the eye gets used to it.
- Clicking through is fine, searching is not. Anyone who wants to know why a number dropped clicks through to the details. The home screen stays calm.
Sometimes less design is simply better. A managing director who gets five numbers by email every morning gets more out of that email than out of a dashboard he has to log into. In that case a dashboard is not the answer, but a good notification is.
Where does AI help with a KPI dashboard, and where not?
AI helps with three things: summarising numbers in plain language, flagging deviations before anyone spots them and answering questions such as "why did margin drop in September?". However, AI does not choose your KPIs and it cannot fix messy source data. The decision also stays with a person.
In practice it looks like this. Every Monday an AI employee reads the dashboard, writes a five-line summary for the management team and puts the biggest deviations at the top. That is exactly what our AI employee for management reporting does. If you want to ask questions of your own numbers, the AI data analyst is a better fit.
The tools themselves contain more and more AI too. Copilot in Power BI can summarise a report and answer questions about your data. According to Microsoft Learn, that does require paid Fabric capacity from F2 or Premium from P1; a Pro licence alone is not enough (accessed October 2026).
Where AI does not help: when your source data is wrong. A language model that summarises the wrong revenue figure gives you a convincing wrong story. Get the definitions and integrations right first, and only then add AI. It is the same principle as with any AI application: first the opportunity, then the technology.
What you often see: AI neatly flags a deviation, but the cause is a broken integration or an invoice booked twice, not a real drop. So let someone who knows the numbers check a flag before the management team acts on it.
Who owns the KPI dashboard?
Every KPI dashboard needs two owners: a business owner who decides which numbers are on it and what they mean, and a technical owner who keeps the integrations working. Without those two names a dashboard goes out of date within six months, however well it was built.
The business owner is usually the managing director, the finance manager or the head of operations. That person also decides when a KPI comes off. Because dashboards only ever grow if nobody tidies up.
The technical owner can be a colleague, but also your IT partner. Systems change. Exact gets an update, your CRM gets a new field, someone renames a column in Excel. Then something breaks, and you want someone to notice before the board sees wrong numbers.
A practical agreement: put the names of both owners and the date of the last update at the bottom of the dashboard. It costs nothing, and it prevents the question "is this still right?".
Which mistakes do you often see with a KPI dashboard?
The mistakes I see most: too many numbers, no agreement on the source, manual exports, no owner and a dashboard that nobody asks for a decision. Almost always the project started with the tool instead of the question. That is also the good news, because you can still fix it afterwards.
A few mistakes up close:
- Showing everything because you can. An integration with your CRM gives you a hundred fields. Yet you might need four.
- Vanity metrics. Followers, page views and opened emails feel good. They rarely say anything about revenue.
- Manual work dressed up as automation. A dashboard that needs an hour of copying and pasting every week costs 46 hours a year, counting 46 working weeks. What that means in euros, you can work out with the manual work calculator.
- No link to the meeting. If the management team still discusses a PDF on Monday, nobody opens the dashboard.
We are still learning too. On the data platform for that financial organisation, looking back, I would have set up the design system earlier in the project. The sooner everyone uses the same components, the less you have to straighten out later.
How do you build a KPI dashboard in six steps?
You build a KPI dashboard in six steps: define the question, set the KPIs and definitions, choose and connect the sources, make a simple design, test with real numbers and appoint an owner. You only choose the tool at step four.
- Define the question. What does the board want to know every week? Write it down as one question.
- Choose the KPIs and definitions. Five to eight numbers, each with a source, definition and target.
- Connect the sources. First the integrations with accounting, CRM and planning, then the screen.
- Design and build. Choose the tool that fits your data and keep the home screen calm.
- Test with real numbers. Put the outcome next to last month's accounts. If it differs, find out why.
- Appoint owners. One business owner and one technical owner, and put the dashboard on the management team's agenda.
Most teams skip step 5. Yet that is exactly where a dashboard wins or loses trust. One wrong number in the management meeting, and the managing director asks for the controller's spreadsheet again.
Should you build a dashboard yourself or have one built?
Building a dashboard yourself works fine if you have one source, someone with time and a question that does not change. Having one built pays off when you need to connect several systems or when the board has to rely on the numbers. The same goes when the dashboard has to live inside your own software. Then most of the work sits in the integrations and the data model.
Not sure? Then start with the question of which manual work the dashboard should replace. That is also where the AI Opportunity Audit begins: we look at where your team loses time, including on reporting and gathering numbers, and what could be better. Sometimes the answer is a dashboard. Sometimes it is an AI employee that emails a summary. And sometimes the answer is that your existing spreadsheet is fine. For the financial organisation from the introduction, the answer was one integrated data platform with role-based access.
Already know you want a dashboard? Then read how we approach dashboard development, from gathering questions to maintenance. For a broader view of where to start with AI, see AI implementation for SMEs.
Frequently asked questions
What is a KPI dashboard?
A screen with the five to eight key numbers of your business, updated automatically from your systems and always shown next to a target or previous period. Within a minute it shows whether you are on track and where you need to step in.
How many KPIs should a dashboard have?
Five to eight per dashboard. If you need more, make a second dashboard for a different question or department, instead of one screen with everything.
What is the difference between a KPI dashboard and a management dashboard?
In practice, not much. A management dashboard is a KPI dashboard for the board or management team, with numbers for the whole company. Departmental dashboards go deeper into one team.
Can I build a KPI dashboard in Excel?
Yes, if you have one source and a small team. As soon as you combine numbers from several systems or share the dashboard with more people, Excel takes a lot of manual work. Then Power BI or custom software makes more sense.
Can AI replace my dashboard?
Not entirely. AI can summarise your numbers, report deviations and answer questions, but it needs the same reliable source and definitions as a dashboard. Without good data you just get a wrong answer faster.